eDAR and the switch
eDAR
As a first approximation, suppose that the only electron donors and acceptors in our system are glucose and oxygen and that the main metabolic pathway is cellular respiration. Then, we have:
\[\begin{equation} eDAR=6\frac{C_{6}H_{12}O_6}{O_2} \, , \end{equation}\]where the factor 6 accounts for the stoichiometry of cellular respiration. Theoretically, eDAR can get any value between \(0\) and \(\infty\). However, that would not be consistent with real ecological systems. According to Silveira et al, 2019, \(eDAR_{min}=0.24\) and \(eDAR_{max}=1.36\). For modeling purposes and to be more agnostic, we define:
\[\begin{eqnarray*} eDAR_{min}=0.1\\ eDAR_{max}=1.5 \, , \end{eqnarray*}\]as the minimum and maximum values of eDAR than can be found in any natural system than can sustain life. Low eDAR values correspond with extremely anaerobic environments (and metabolic pathways), while high values correspond to catabolic environments.
Our hypothesis is that the lytic-lysogenic switch is driven by metabolism. Lysogeny dominates in anaerobic environments (low eDAR) and lysis predominates in catabolic environments (high eDAR) and that the transition from one regime to another is very sharp.
The switch
We use a modified Hill Function to model the lytic-lysogenic switch. Hill functions are sigmoid, and model very well the behavior we hypothesize for the lytic-lysogenic switch. O function needs to be modified because Hill Functions have a domain between \(0\) and \(\infty\). We propose a function that meets the following conditions:
- \[H'(eDAR_{min})=0\]
- \[H'(eDAR_{max})=1\]
- \[H'(eDAR=1)=0.5\]
The analytical expression of this function is:
\[\begin{equation*} H'(eDAR)=\frac{(eDAR - eDAR_{min})^{n}}{K^n + \alpha (eDAR - eDAR_{min})^{n}} \, , \end{equation*}\]where \(\alpha=\frac{(eDAR_{max} - eDAR_{min})^{n} - 2(1 - eDAR_{min})^{n}}{(eDAR_{max}- eDAR_{min})^{n} - (1 - eDAR_{min})^{n}}\) and \(K=(2-\alpha)^{1/n}(1-eDAR_{min})\). \(\alpha\) is a parameter that forces \(H'(eDAR_{max})=1\) and \(K\) represents the value of eDAR such that \(H'(eDAR=1)=0.5\).
For n=7, the function has the following shape:
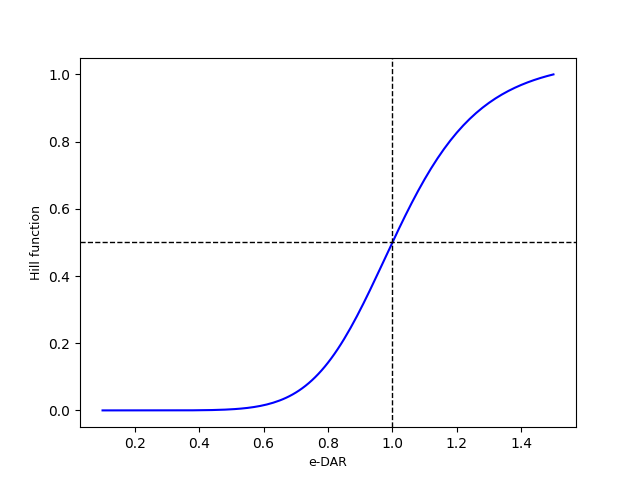
In the population dynamics model described in the next section, \(H'(eDAR)\) controls the probability of lysogeny \(\mathcal{P}(L)\) and the induction rate of lysogens \(\mu_i\).
We define second modified Hill function \(H''(eDAR) = 1 + H'(eDAR)\) that affects the growth rate of bacteria and lysogens in the population dynamics model.